


United Kingdom (EN)
Select your region or country.
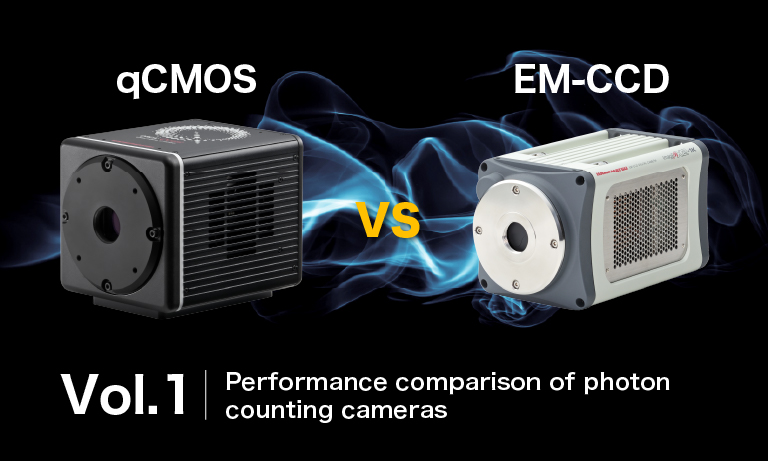
qCMOS® camera vs. EM-CCD camera vol.2 – Qubit state detection
Quantum computing promises to overcome the limitations of Moore's Law, and significant research is focused on its industrialization. Various hardware approaches exist, with neutral atoms and ions (hereafter collectively referred to as “atoms”) being leading contenders.
These systems require high-speed, high-precision detection of atomic fluorescence to determine qubit states, making advanced cameras critical to overall performance. While EM-CCD cameras were traditionally used in this application, ultra-sensitive CMOS cameras, like the qCMOS camera (the ORCA-Quest series) from Hamamatsu Photonics, now offer comparable sensitivity with much superior speed and spatial resolution to EM-CCD cameras (See qCMOS vs EM-CCD Vol. 1).
To help users select the best camera, we simulated the fidelity of atomic fluorescence detection for quantum computing using our state-of-the-art qCMOS camera, a sCMOS Gen III camera (the generation preceding qCMOS), and a traditional EM-CCD cameras. This analysis aims to spark discussion on how advancing CMOS technology can accelerate breakthroughs in quantum computing.
Method for calculating the fidelity of atomic fluorescence detection
The fidelity of atomic fluorescence detection can be quantitatively evaluated based on the following three steps.
(i) Acquisition of integrated intensity via image simulation
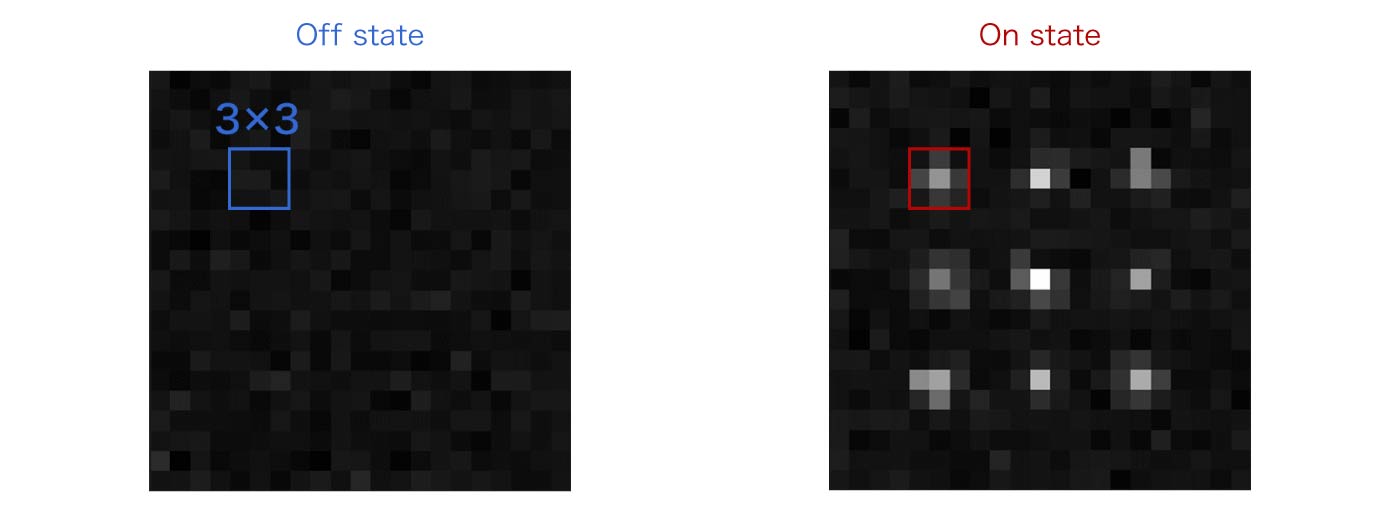
For each of the 'On' and 'Off' states, 100,000 simulation frames are generated, and the integrated intensity value is determined for a 3×3 pixel array surrounding an atom in each frame.
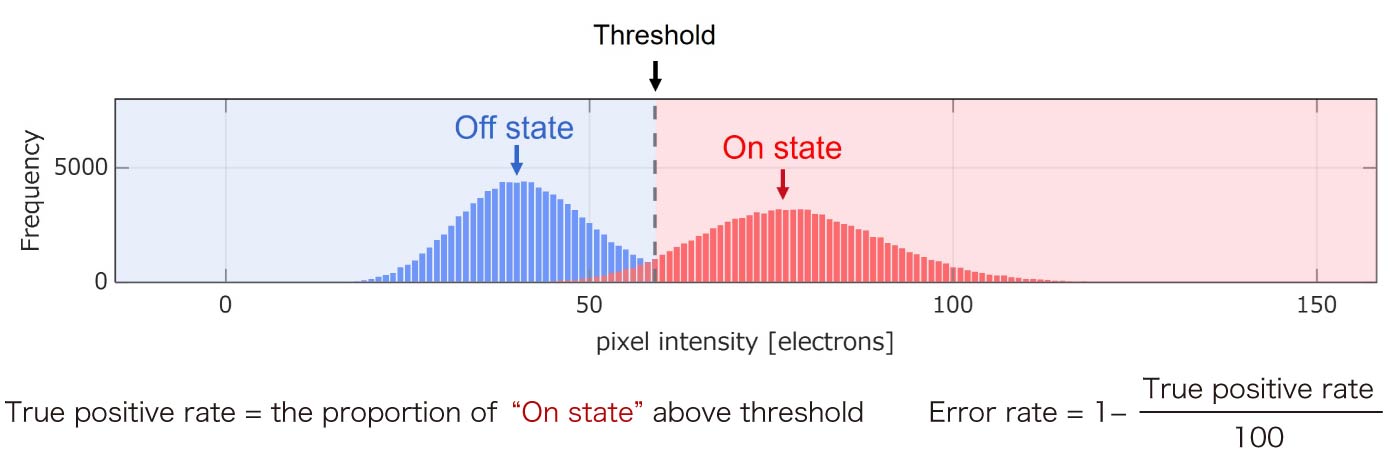
(ii) Threshold determination via histogram analysis
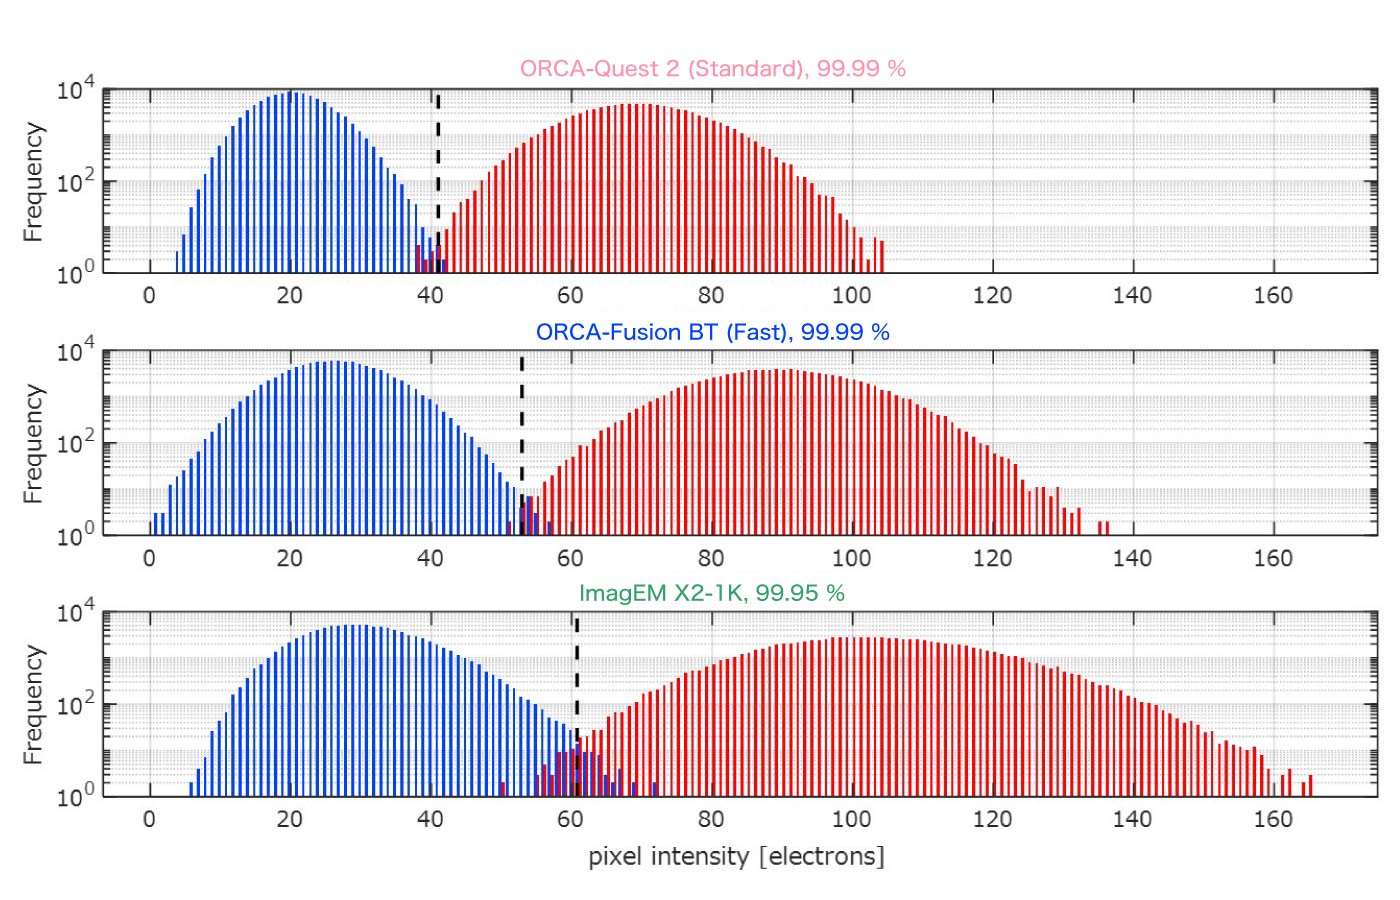
A frequency histogram of the integrated intensity values is created for each state, and the position where the histograms intersect is set as the threshold for distinguishing between the 'On' and 'Off' states. (If the histograms do not intersect, the midpoint is used)
(iii) Calculation of fidelity metrics
The "True positive rate" (the proportion of 'On state' integrated intensity values that are above the threshold) and the "Error rate" (=1 – “True positive rate” / 100) are calculated.
- True positive rate: The proportion of On-state frames with integrated intensity above the threshold.
- Error rate: 1-True positive rate/100
Simulation conditions for atomic fluorescence detection
In this simulation, we set the following conditions to quantitatively evaluate the fidelity of atomic fluorescence detection and compare the performance of different camera systems.
Wavelength
- 493 nm (Ba+ ion)
- 780 nm (Rb atom)
Optics
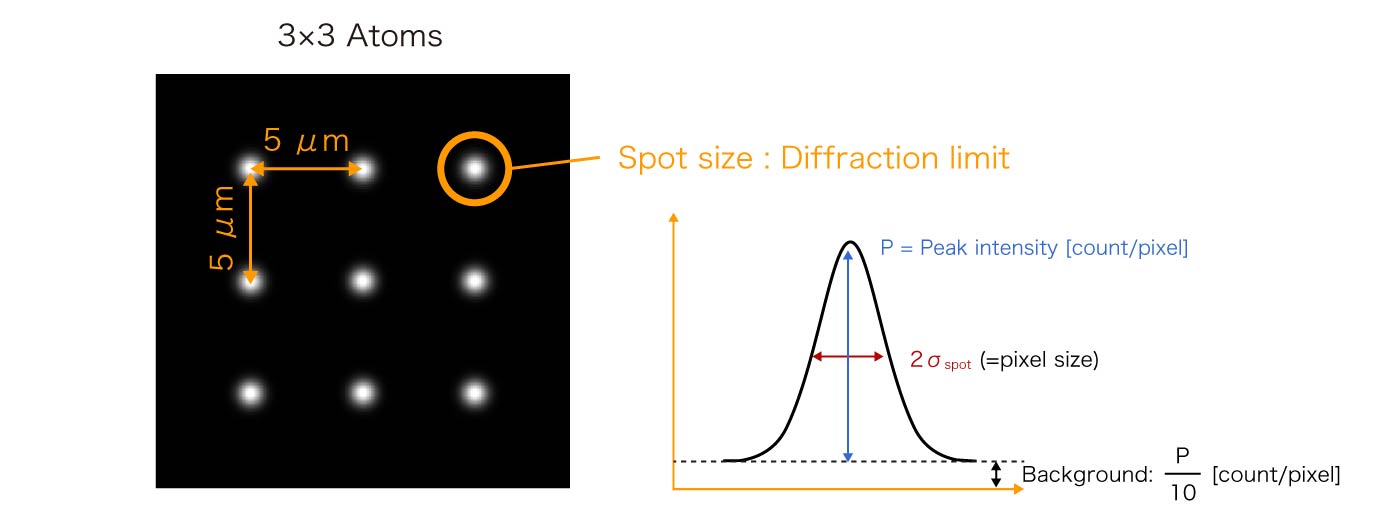
- Spot size: Diffraction-limited spot with a spread of σspot=1.22 NA/λ
- Objective lens NA: 0.8
- Objective lens magnification: Set so that 2σspot equals to pixel size for each camera
Signals
- Atom signal: 104 photons/sec/atom
- Background signal: one-tenth of the fluorescence peak (referring to the actual experimental environment)
Camera parameters
The camera parameters particularly relevant to this simulation are described below. (Since high-speed imaging is required for this application, the noise values are based on the fastest scan mode for each camera.)
| Specifications | ORCA-Quest 2 qCMOS camera |
ImagEM® X2-1K*1 EM-CCD camera |
ORCA-Fusion BT sCMOS Gen III camera |
|---|---|---|---|
| Pixel size (μm) | 4.6×4.6 | 13×13 | 6.5×6.5 |
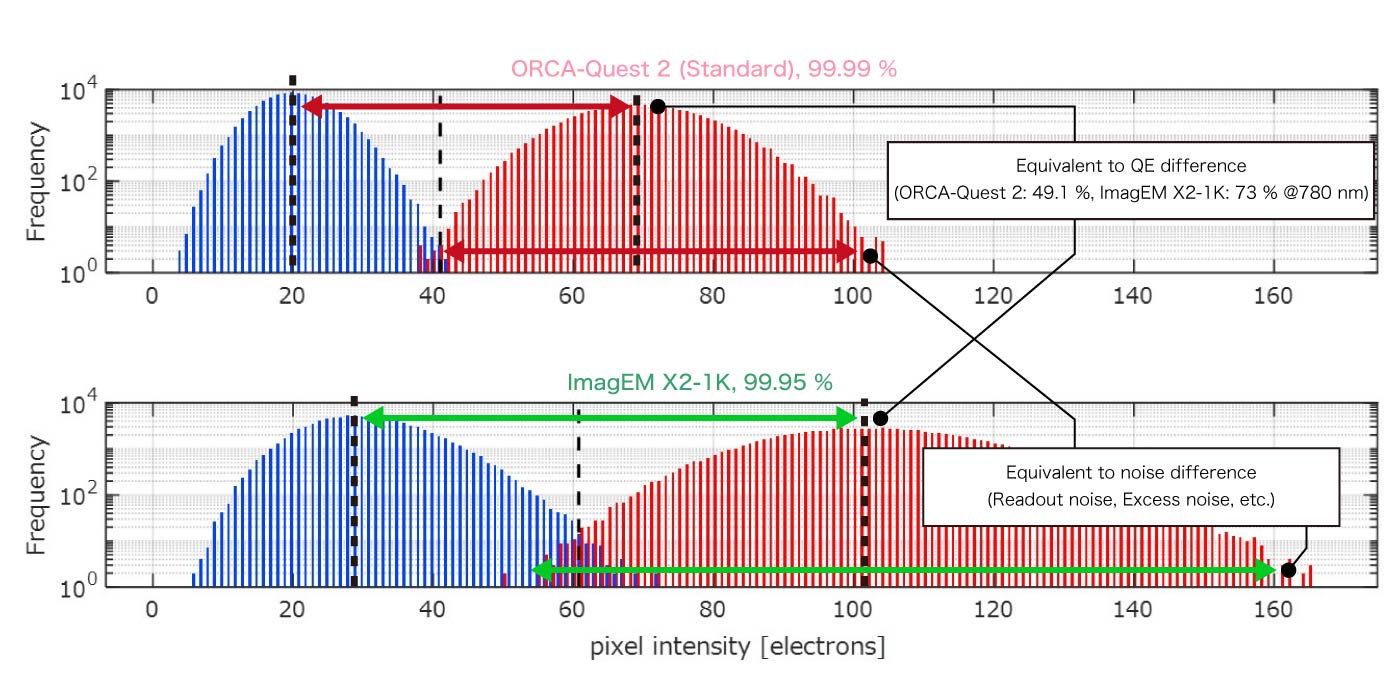
| QE (493 nm / 780 nm) | 84 % / 49.1 % | 90 % / 73 % | 90 % / 63.3 % |
| Readout noise (e- rms) | 0.43 | < 1.0 (M =1200) | 1.6 |
| Data rate (Megapixel/sec) | 1,130 | 10 | 470 |
*1 EM-CCD from Hamamatsu Photonics. It is now discontinued and no longer manufactured or sold.
While CMOS cameras have the high data rate (="the number of pixel" × "frame rate") required for quantum computers, a critical point in determining their viability for this application is how high a fidelity they can demonstrate compared to EM-CCD cameras. QE should particularly be noted, as EM-CCD cameras often have a relatively higher QE than qCMOS cameras, especially in the near-infrared region, which is 780 nm in this case.
Simulation results and discussion
The fidelity of atomic fluorescence detection strongly influences the performance of a quantum computer, and even the difference between 99 % and 99.9 % creates a significant impact. In this simulation, the comparison will focus on fidelities of 99 % or higher (an error rate of 1% or less).
Simulation result: 493 nm wavelength (Ba+ ion)
Simulation images
- Exposure time: 10 ms
- Atom signal: 100 photons/atom/frame
- Background signal: 4.7 photons/pixel/frame

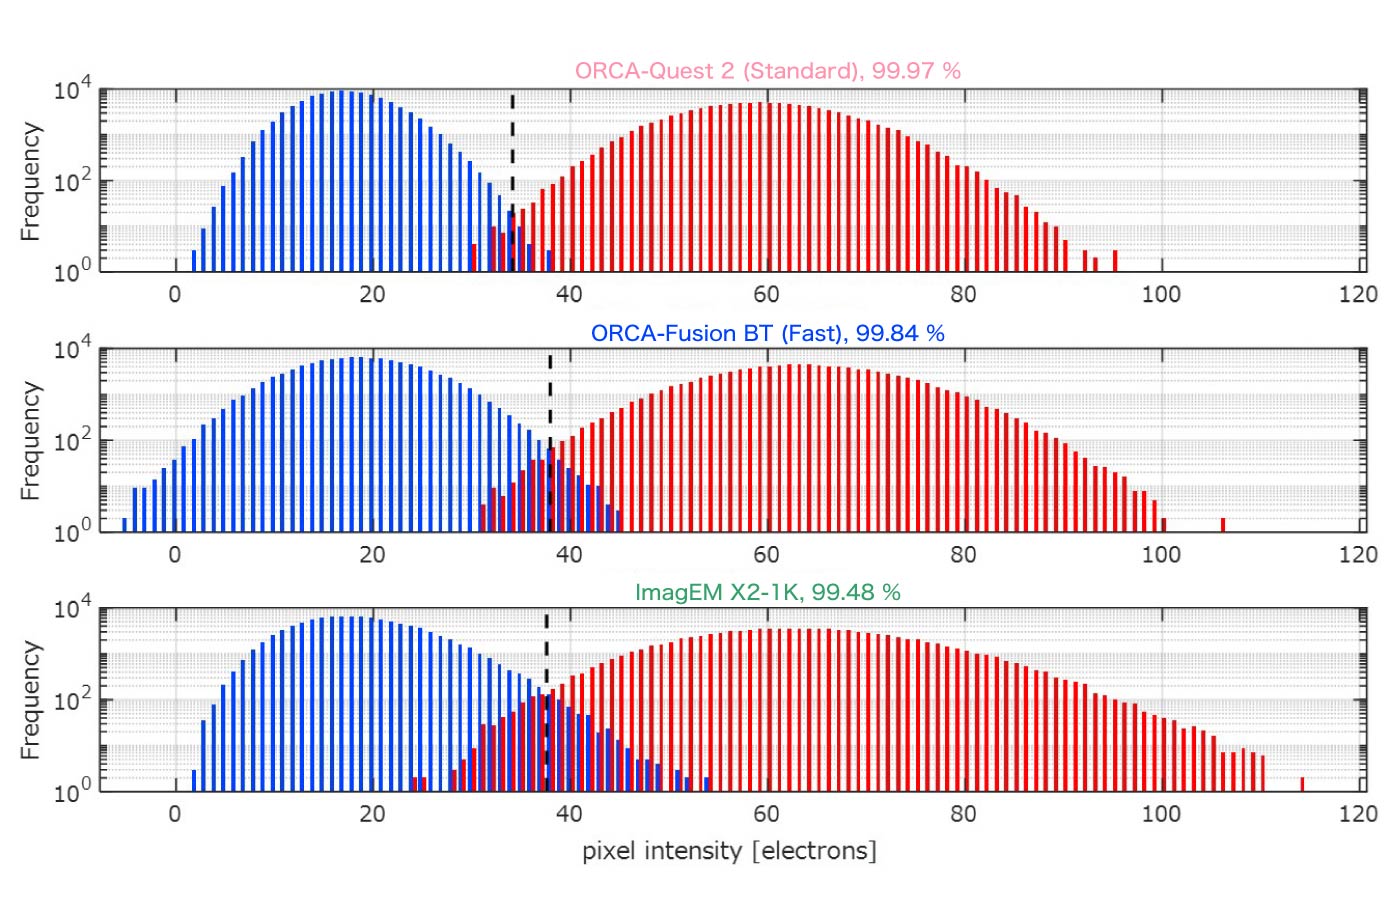
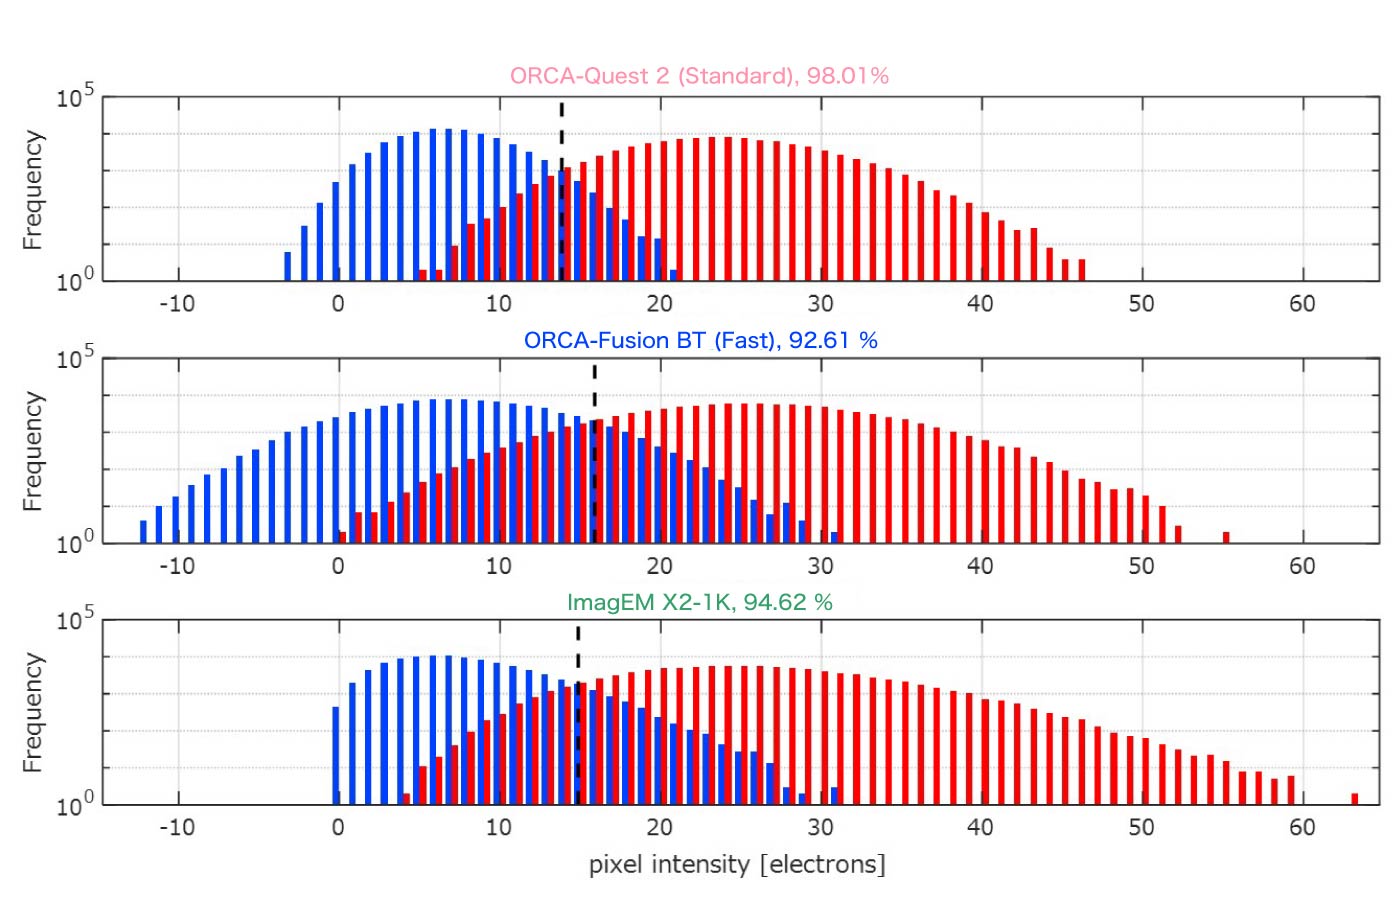
Frequency histogram comparison
- Exposure time: 10 ms
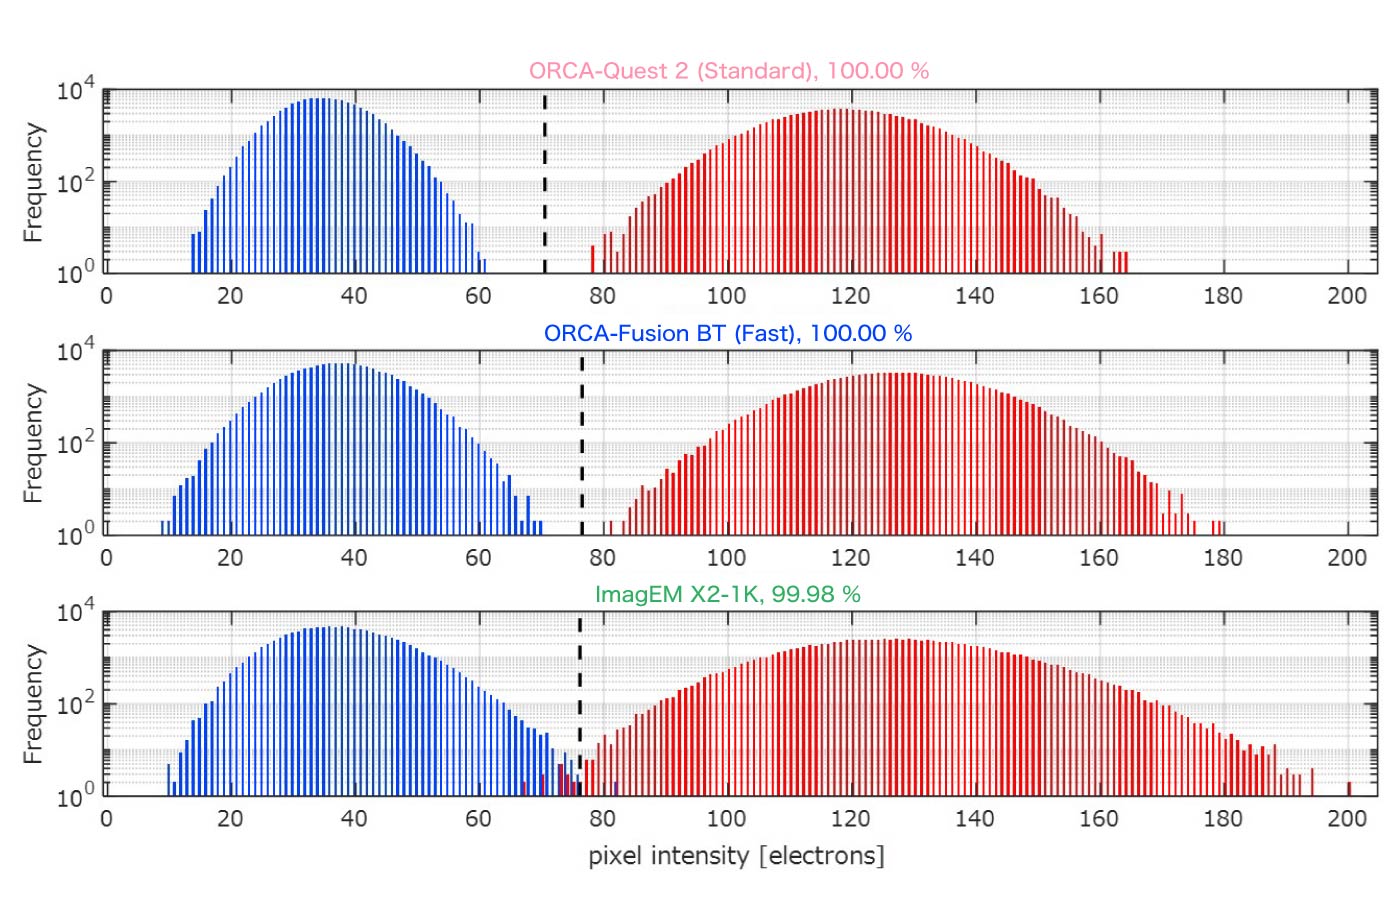
* For the EM-CCD camera, the horizontal axis is normalized to the number of detected photoelectrons by dividing by the gain.
- Exposure time: 5 ms
- Exposure time: 2 ms
Error rate comparison
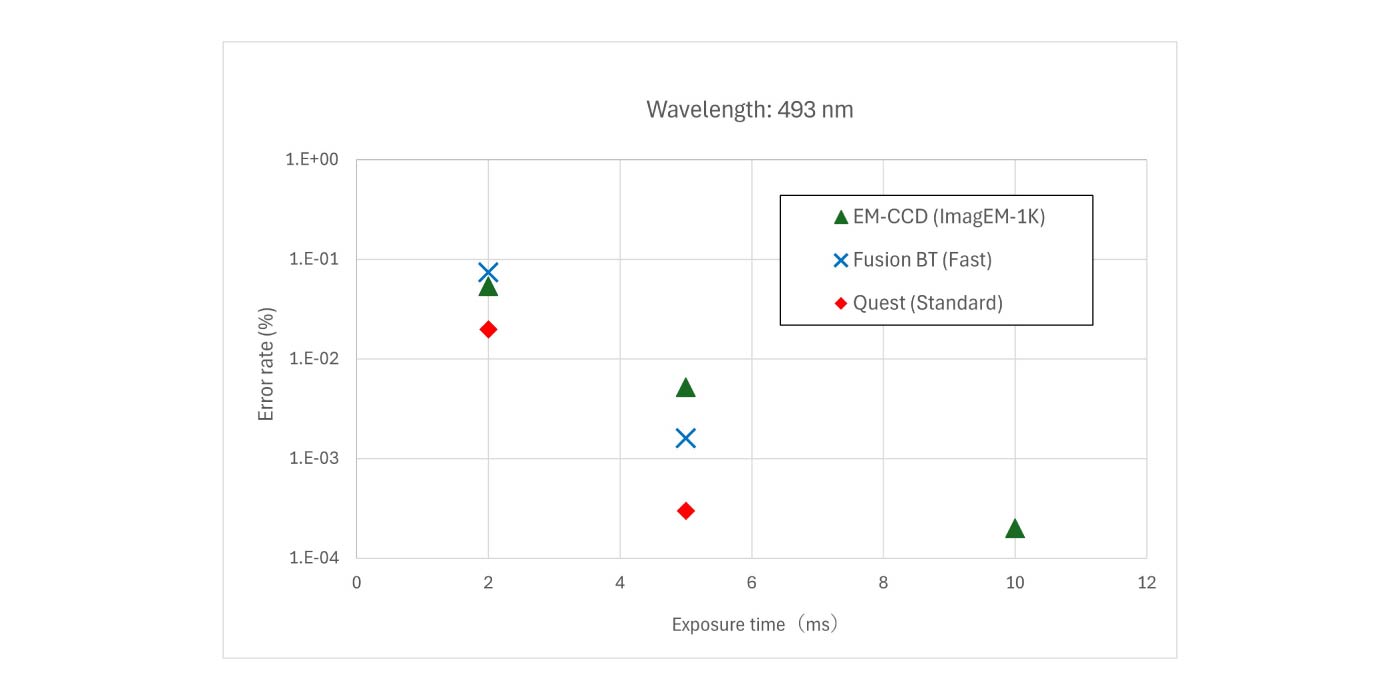
* At the 10 ms exposure time, the ORCA-Quest 2 (Standard) and ORCA-Fusion BT (Fast) are not displayed on the logarithmic graph because their error rate is 0.
Simulation result: 780 nm wavelength (Rb atom)
Simulation images
- Exposure time: 10 ms
- Atom signal: 100 photons/atom/frame
- Background signal: 4.7 photons/pixel/frame

Frequency histogram comparison
- Exposure time: 10 ms
- Exposure time: 5 ms
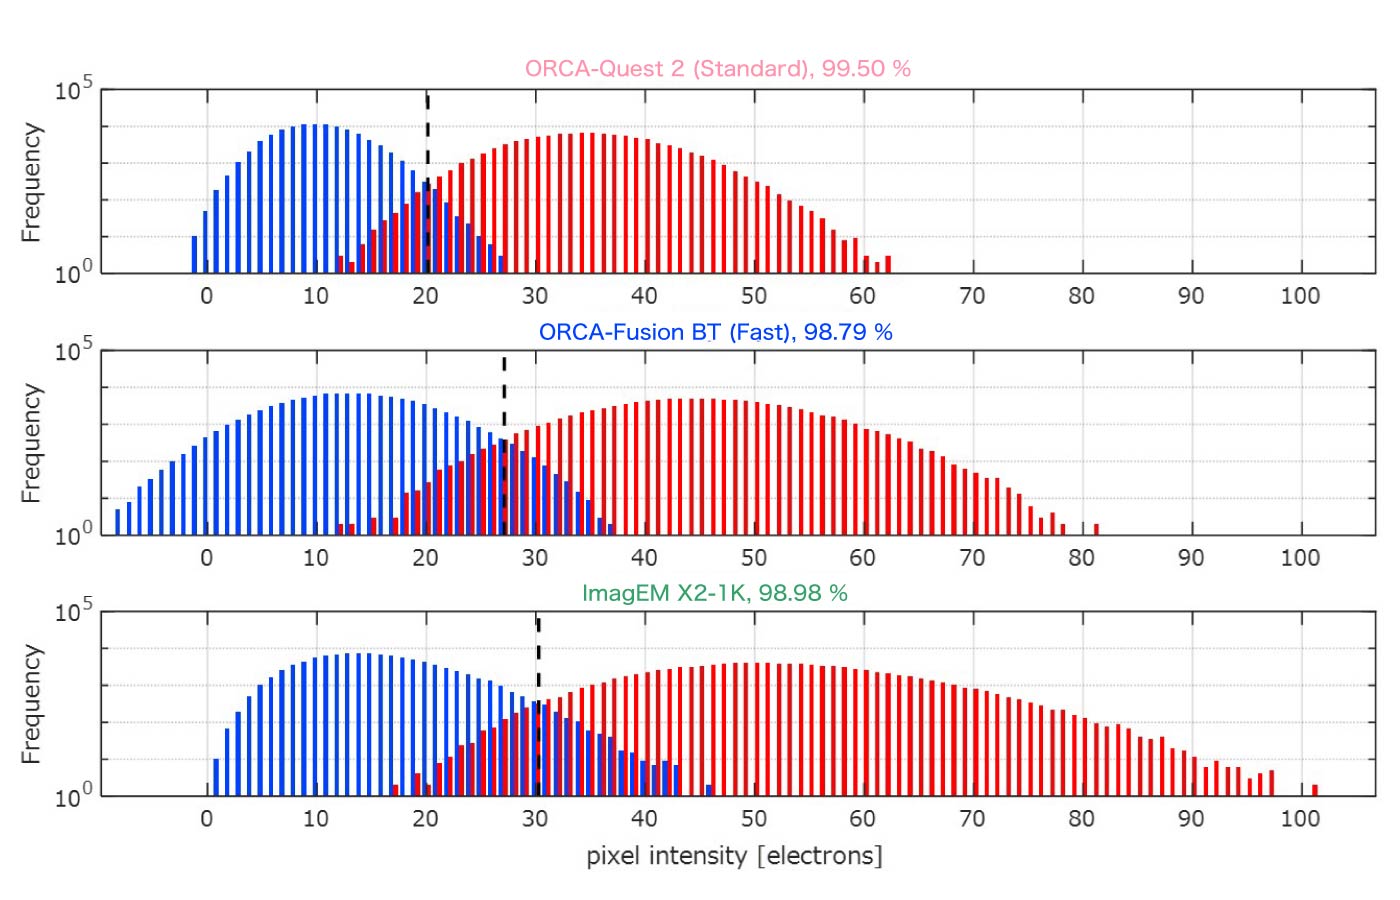
- Exposure time: 2 ms

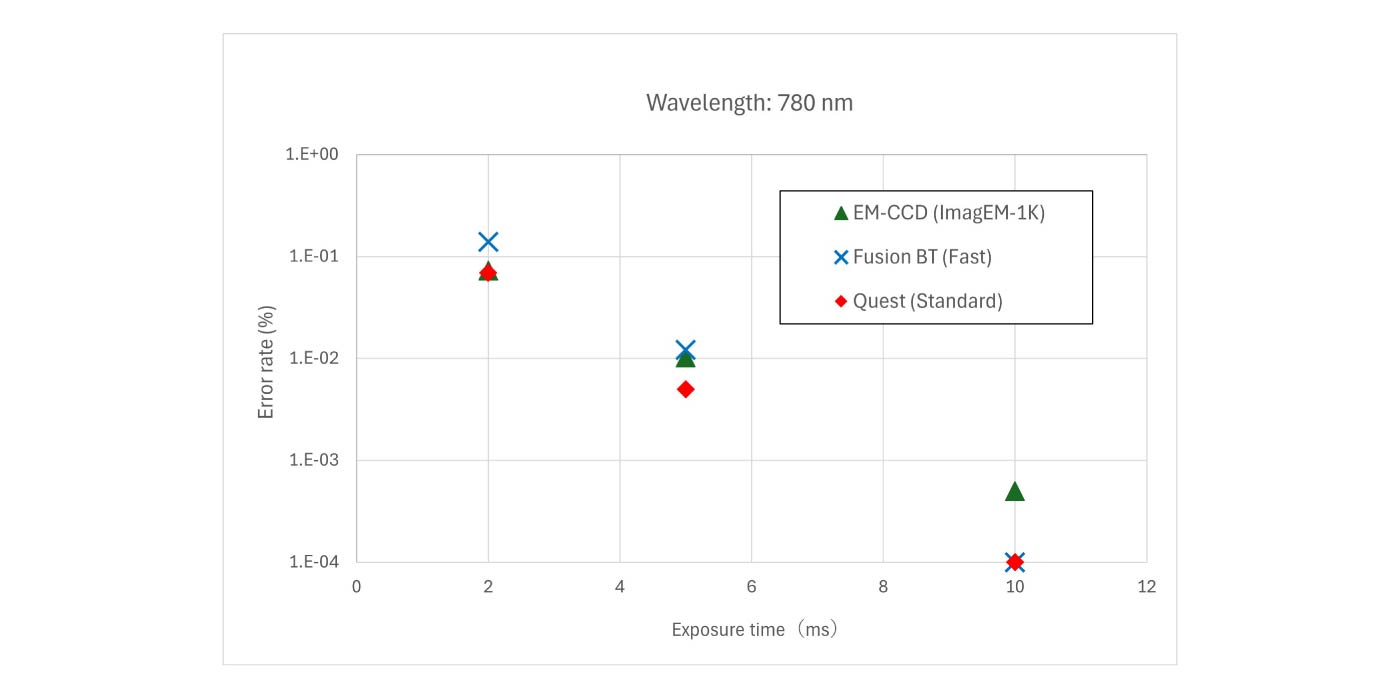
Error rate comparison
Discussion
In this simulation, the qCMOS camera showed particularly superior results to the EM-CCD camera in terms of error rate at a wavelength of 493 nm, and slightly superior results even at 780 nm where there is a large difference in relative QE. Interestingly, the ORCA-Fusion BT, a sCMOS Gen III camera from the generation preceding the qCMOS, also showed superior results to the EM-CCD camera in the region of less than 1% error rate.
The reason for this is that while EM-CCD cameras achieve ultra-high sensitivity through electron multiplication, the fluctuation from this process (called “Excess noise”) is unavoidable and significantly affects quantitative measurement. In qubit state detection, which requires quantitative measurement to achieve high detection fidelity, this causes the histogram to widen, as seen in the figure provided in the document. As a result, the qCMOS camera showed better fidelity even with its relatively lower QE.
For reference, a simulation under conditions with absolutely no background signal is also attached. Although assuming zero background is unrealistic for quantum computers where lasers are used for atom manipulation and qubit state detection, this is included for comparison because the background significantly affects the sensitivity of EM-CCD cameras. Under these zero-background conditions, the qCMOS camera was still superior at 493 nm, but the EM-CCD camera was superior at 780 nm.
Conclusion
This simulation showed that for atomic fluorescence detection, the qCMOS camera demonstrates superior fidelity to the EM-CCD camera in most cases.
With the increasing sensitivity of CMOS cameras, we believe that qCMOS cameras, as ultra-sensitive imaging devices that combine high speed and high resolution, will contribute to the calculation speed enhancement and qubit scalability improvement on neutral atom and ion quantum computers.
Case study
Camera articles
Related products
- Confirmation
-
It looks like you're in the . If this is not your location, please select the correct region or country below.
You're headed to Hamamatsu Photonics website for GB (English). If you want to view an other country's site, the optimized information will be provided by selecting options below.
In order to use this website comfortably, we use cookies. For cookie details please see our cookie policy.
- Cookie Policy
-
This website or its third-party tools use cookies, which are necessary to its functioning and required to achieve the purposes illustrated in this cookie policy. By closing the cookie warning banner, scrolling the page, clicking a link or continuing to browse otherwise, you agree to the use of cookies.
Hamamatsu uses cookies in order to enhance your experience on our website and ensure that our website functions.
You can visit this page at any time to learn more about cookies, get the most up to date information on how we use cookies and manage your cookie settings. We will not use cookies for any purpose other than the ones stated, but please note that we reserve the right to update our cookies.
1. What are cookies?
For modern websites to work according to visitor’s expectations, they need to collect certain basic information about visitors. To do this, a site will create small text files which are placed on visitor’s devices (computer or mobile) - these files are known as cookies when you access a website. Cookies are used in order to make websites function and work efficiently. Cookies are uniquely assigned to each visitor and can only be read by a web server in the domain that issued the cookie to the visitor. Cookies cannot be used to run programs or deliver viruses to a visitor’s device.
Cookies do various jobs which make the visitor’s experience of the internet much smoother and more interactive. For instance, cookies are used to remember the visitor’s preferences on sites they visit often, to remember language preference and to help navigate between pages more efficiently. Much, though not all, of the data collected is anonymous, though some of it is designed to detect browsing patterns and approximate geographical location to improve the visitor experience.
Certain type of cookies may require the data subject’s consent before storing them on the computer.
2. What are the different types of cookies?
This website uses two types of cookies:
- First party cookies. For our website, the first party cookies are controlled and maintained by Hamamatsu. No other parties have access to these cookies.
- Third party cookies. These cookies are implemented by organizations outside Hamamatsu. We do not have access to the data in these cookies, but we use these cookies to improve the overall website experience.
3. How do we use cookies?
This website uses cookies for following purposes:
- Certain cookies are necessary for our website to function. These are strictly necessary cookies and are required to enable website access, support navigation or provide relevant content. These cookies direct you to the correct region or country, and support security and ecommerce. Strictly necessary cookies also enforce your privacy preferences. Without these strictly necessary cookies, much of our website will not function.
- Analytics cookies are used to track website usage. This data enables us to improve our website usability, performance and website administration. In our analytics cookies, we do not store any personal identifying information.
- Functionality cookies. These are used to recognize you when you return to our website. This enables us to personalize our content for you, greet you by name and remember your preferences (for example, your choice of language or region).
- These cookies record your visit to our website, the pages you have visited and the links you have followed. We will use this information to make our website and the advertising displayed on it more relevant to your interests. We may also share this information with third parties for this purpose.
Cookies help us help you. Through the use of cookies, we learn what is important to our visitors and we develop and enhance website content and functionality to support your experience. Much of our website can be accessed if cookies are disabled, however certain website functions may not work. And, we believe your current and future visits will be enhanced if cookies are enabled.
4. Which cookies do we use?
There are two ways to manage cookie preferences.
- You can set your cookie preferences on your device or in your browser.
- You can set your cookie preferences at the website level.
If you don’t want to receive cookies, you can modify your browser so that it notifies you when cookies are sent to it or you can refuse cookies altogether. You can also delete cookies that have already been set.
If you wish to restrict or block web browser cookies which are set on your device then you can do this through your browser settings; the Help function within your browser should tell you how. Alternatively, you may wish to visit www.aboutcookies.org, which contains comprehensive information on how to do this on a wide variety of desktop browsers.
5. What are Internet tags and how do we use them with cookies?
Occasionally, we may use internet tags (also known as action tags, single-pixel GIFs, clear GIFs, invisible GIFs and 1-by-1 GIFs) at this site and may deploy these tags/cookies through a third-party advertising partner or a web analytical service partner which may be located and store the respective information (including your IP-address) in a foreign country. These tags/cookies are placed on both online advertisements that bring users to this site and on different pages of this site. We use this technology to measure the visitors' responses to our sites and the effectiveness of our advertising campaigns (including how many times a page is opened and which information is consulted) as well as to evaluate your use of this website. The third-party partner or the web analytical service partner may be able to collect data about visitors to our and other sites because of these internet tags/cookies, may compose reports regarding the website’s activity for us and may provide further services which are related to the use of the website and the internet. They may provide such information to other parties if there is a legal requirement that they do so, or if they hire the other parties to process information on their behalf.
If you would like more information about web tags and cookies associated with on-line advertising or to opt-out of third-party collection of this information, please visit the Network Advertising Initiative website http://www.networkadvertising.org.
6. Analytics and Advertisement Cookies
We use third-party cookies (such as Google Analytics) to track visitors on our website, to get reports about how visitors use the website and to inform, optimize and serve ads based on someone's past visits to our website.
You may opt-out of Google Analytics cookies by the websites provided by Google:
https://tools.google.com/dlpage/gaoptout?hl=en
As provided in this Privacy Policy (Article 5), you can learn more about opt-out cookies by the website provided by Network Advertising Initiative:
http://www.networkadvertising.org
We inform you that in such case you will not be able to wholly use all functions of our website.
Close